Test Analysis
Our state-of-the-art graphing feature is designed to give you unparalleled control over your battery performance data. Whether you're analyzing complex datasets or making quick comparisons, our tool offers the flexibility and power you need to extract meaningful insights.
Versatile Axes Configuration
Customizable Axes
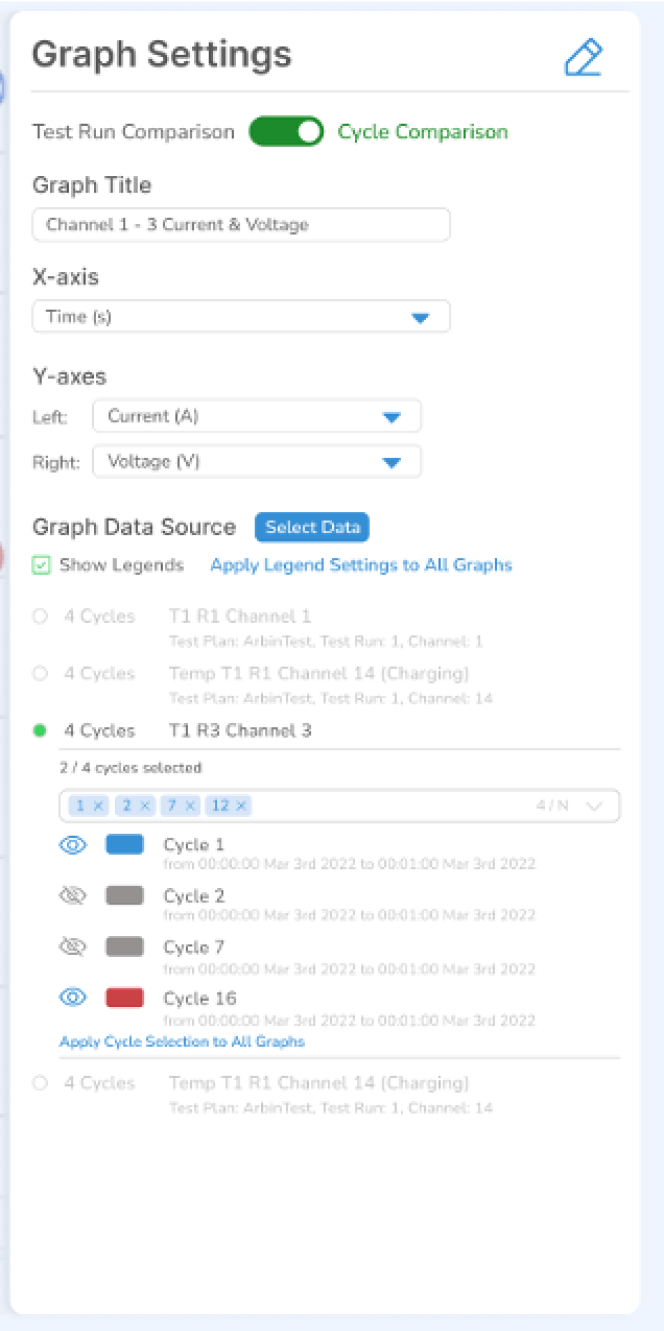
Choose from a variety of variables for both the X and Y axes, allowing you to tailor the graph to display exactly what you need.
Customizable Axes
Choose from a variety of variables for both the X and Y axes, allowing you to tailor the graph to display exactly what you need.
Customizable Graph Styles
Wide Range of Styles
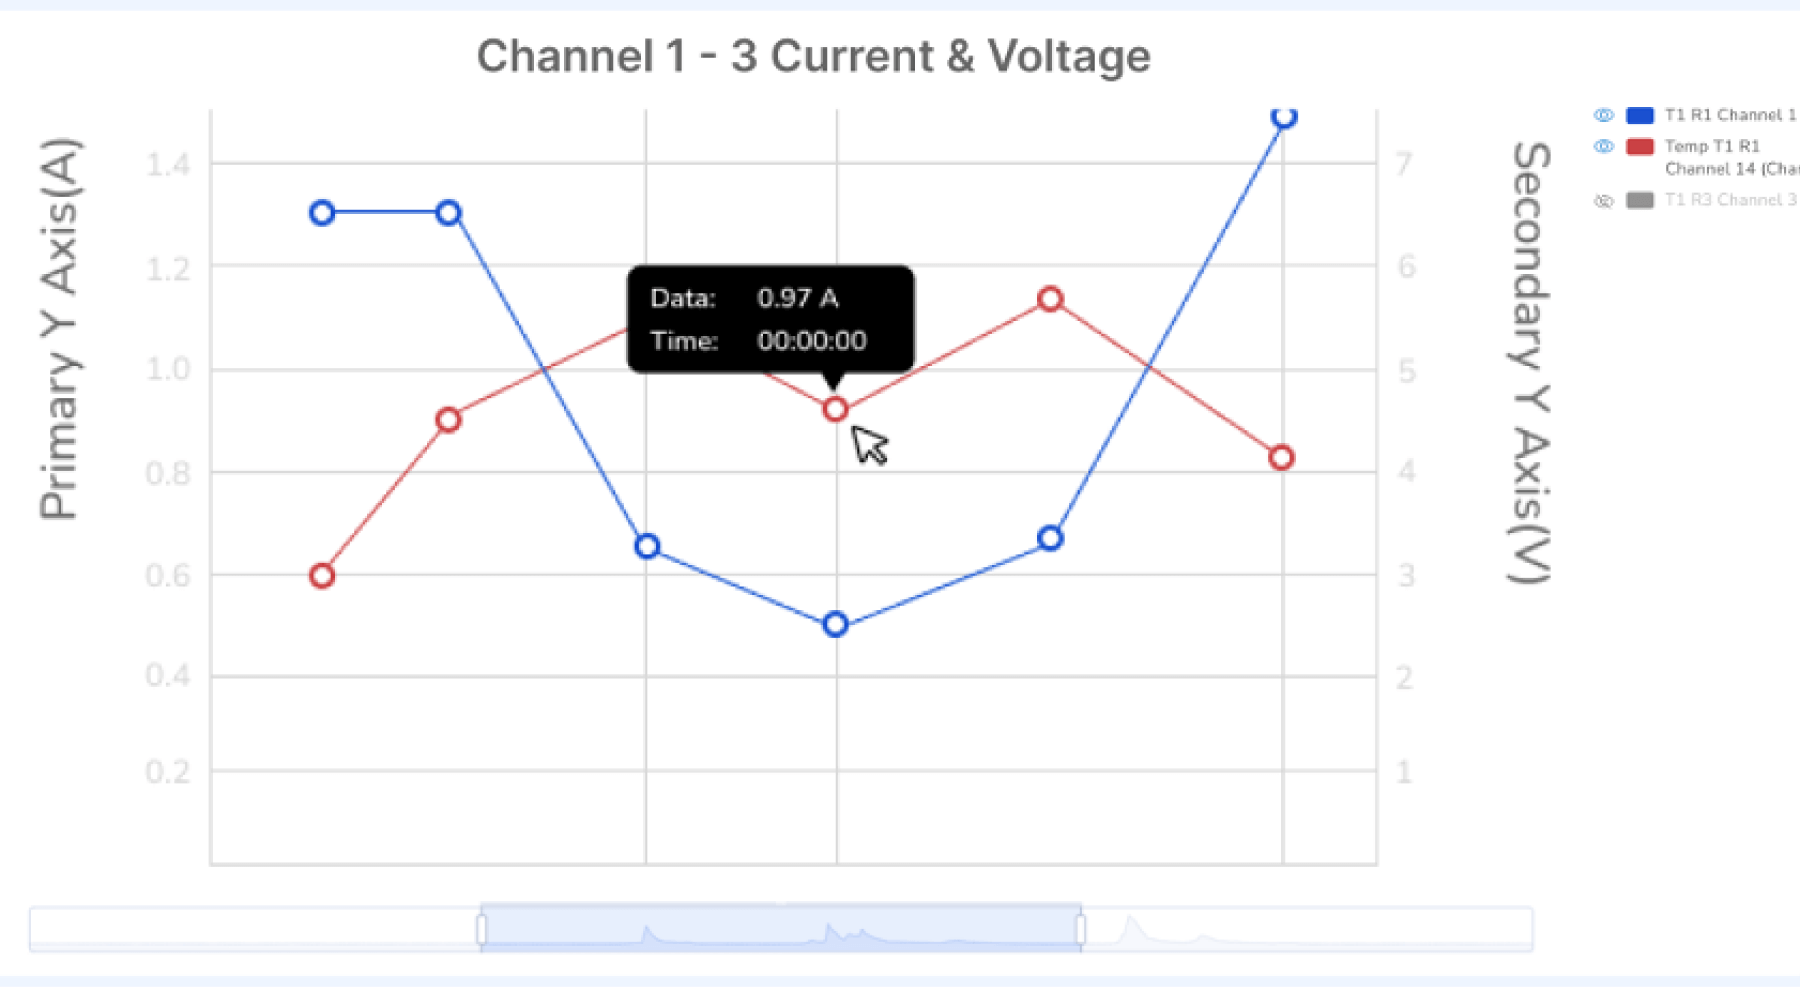
From classic line graphs to advanced scatter plots, our tool supports a multitude of styles that rival the most powerful plotting software on the market.
Tailored Visuals
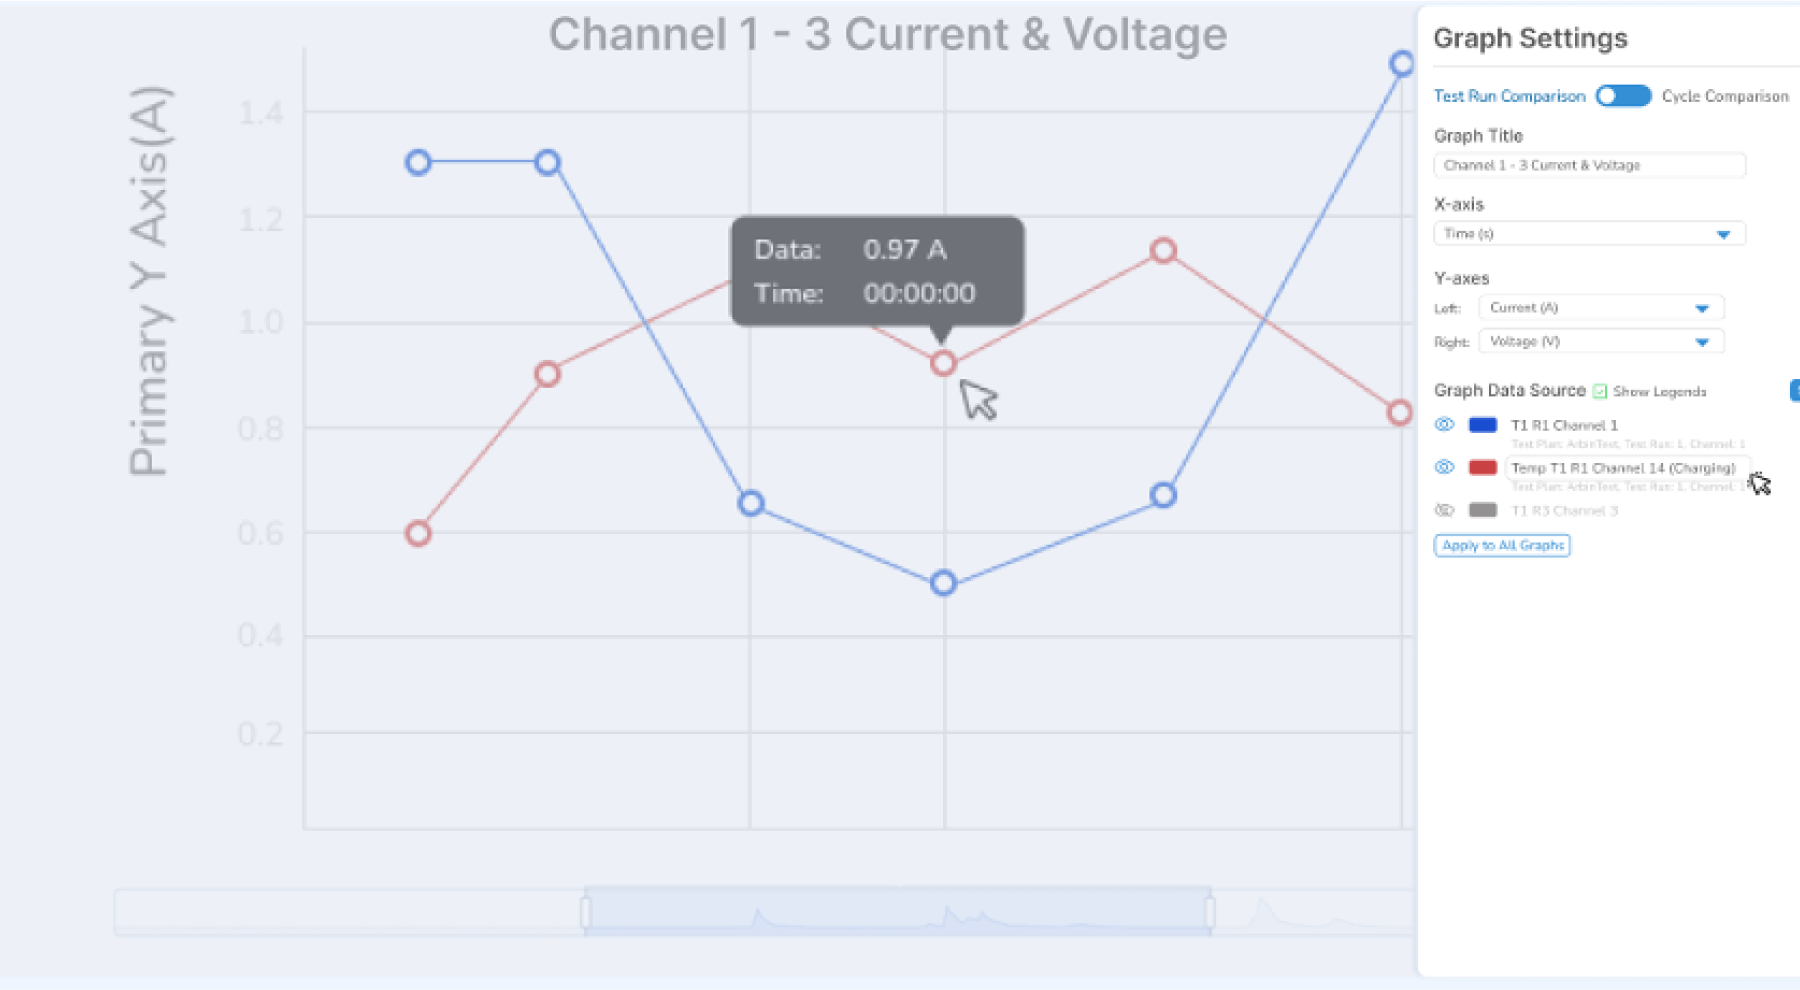
Customize colors, markers, and line types to create graphs that are not only informative but also visually appealing.
One-Click Save
Preserve your work effortlessly with our easy-to-use save functionality.
Export with Ease
Share your findings in various formats with a simple export option, making it easy to include your data in reports or presentations.
Compare and Contrast with Ease
优势
Powerful Template System
Save Your Preferences
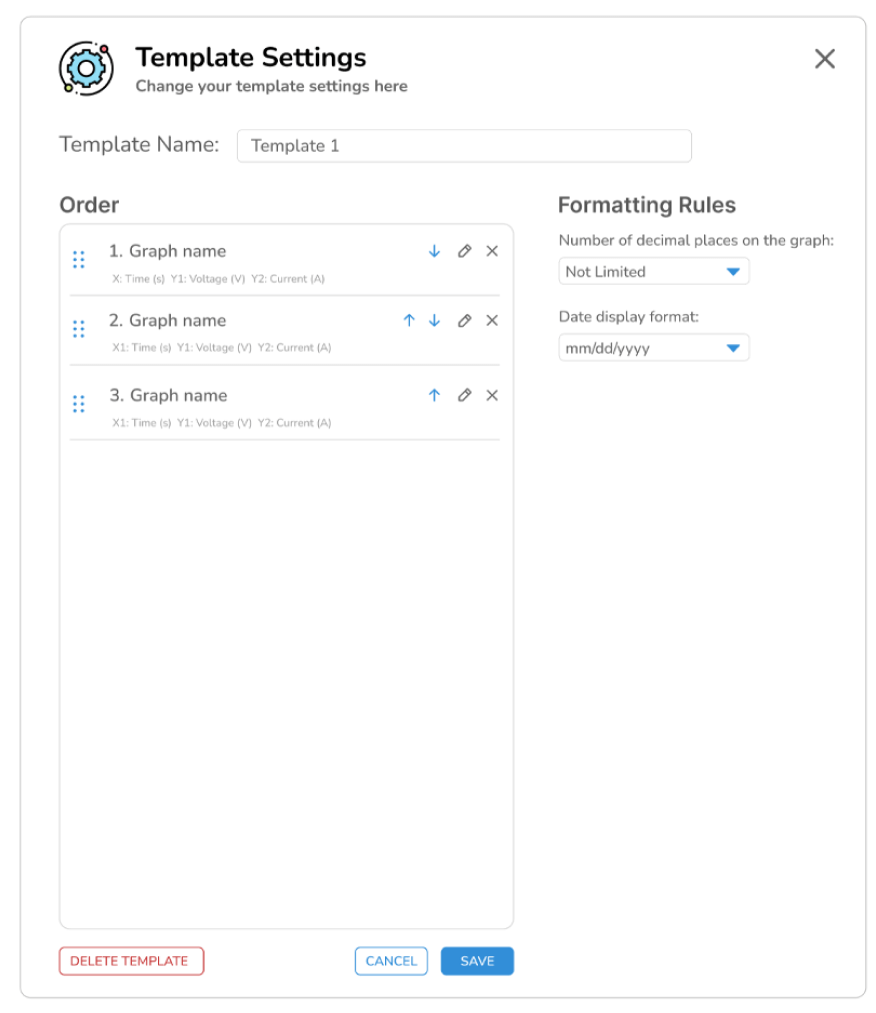
Our robust template system allows you to save graph settings and data choices, enabling quick re-creation of your preferred views.
Flexible Authentication-Based Templates
Easily switch between different templates based on authentication, ensuring that the right people have access to the right data views.
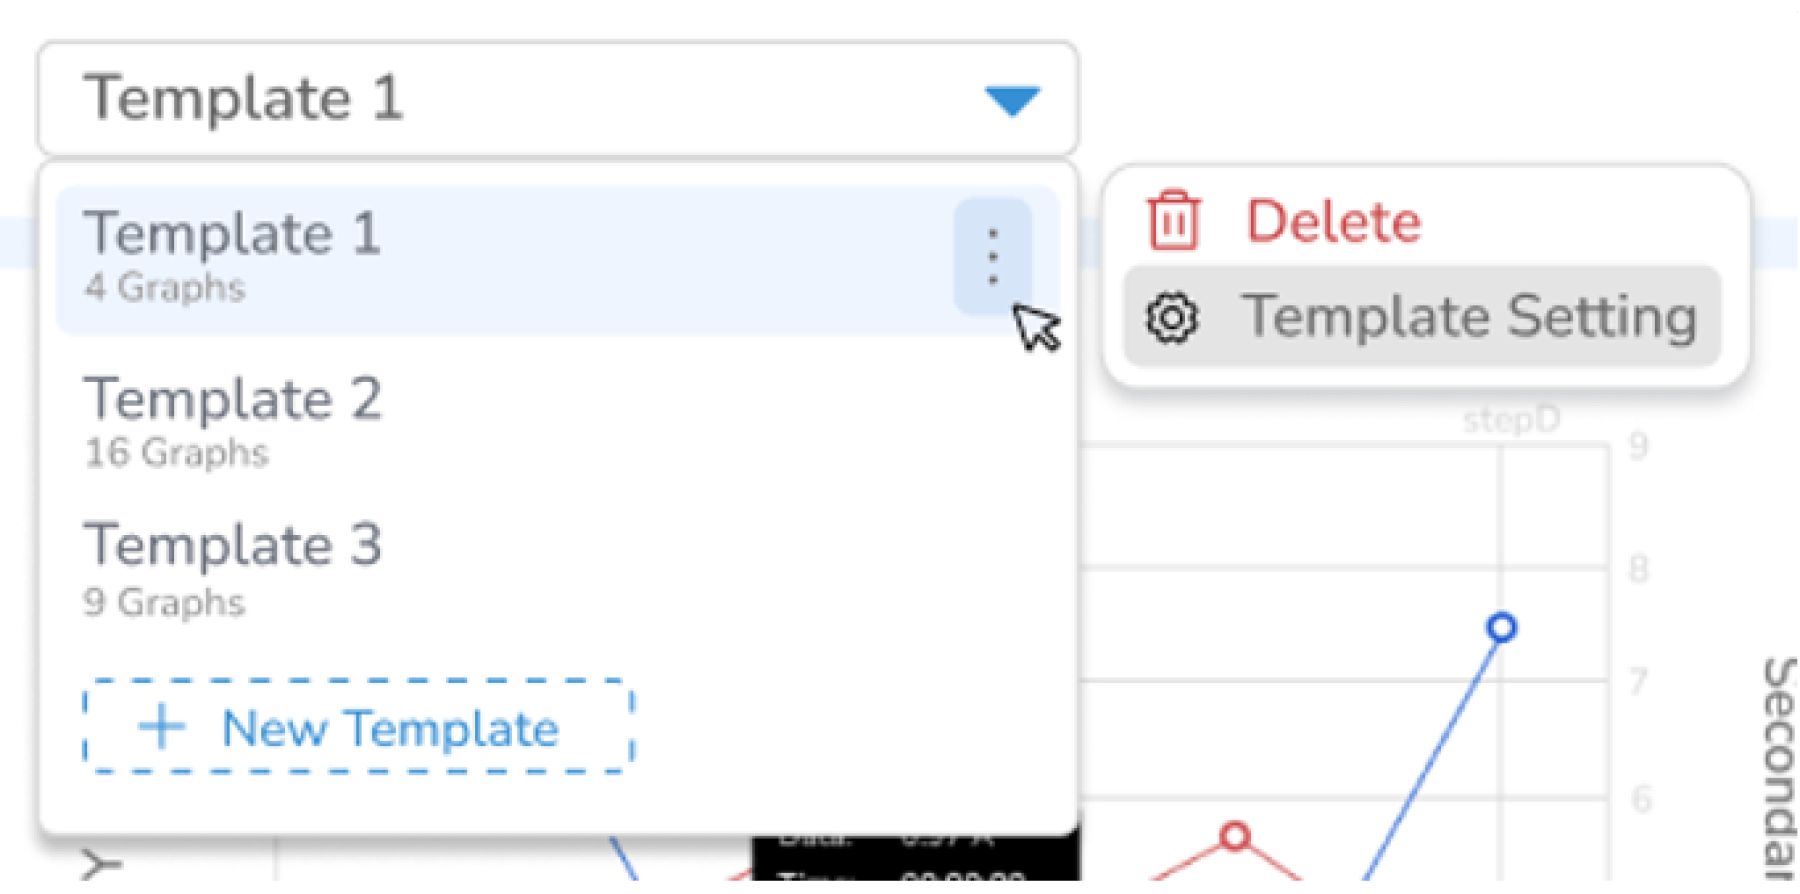
The advanced graphing tool, fully integrated into MITS Pro, redefines how battery performance data is visualized and analyzed.
With no additional installation required, the tool is ready to use immediately, making it simple to transition from raw data to meaningful insights.
Whether there's a need for a quick overview of recent tests or an in-depth exploration of large datasets, the graphing tool offers the precision and versatility required for any analytical task.
Integration within MITS Pro ensures seamless access to the graphing feature across various platforms, eliminating the need for complex setups or additional software. This platform versatility ensures that data is always accessible, regardless of the operating system or device being used.
Furthermore, each platform shares the same intuitive interacting logic, providing a consistent user experience across devices. This consistency simplifies the learning curve and enhances efficiency, as users can switch between platforms without the need to adapt to different interfaces.
Secure, individualized connections are maintained for each user, tailored to specific requirements, further enhancing both security and convenience in data management.
The graphing tool's intuitive design enables rapid deployment, allowing data visualization to begin almost instantly.
Whether the task at hand involves a simple overview of test results or a comprehensive analysis of intricate data patterns, the tool's design facilitates efficient and effective data interpretation.
The user-friendly interface ensures that even complex data sets are easily manageable, making the process of extracting insights both swift and straightforward.
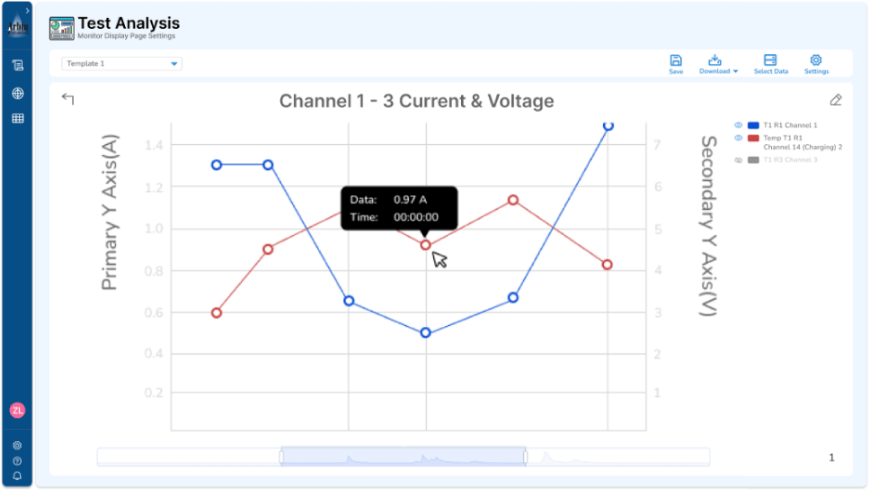
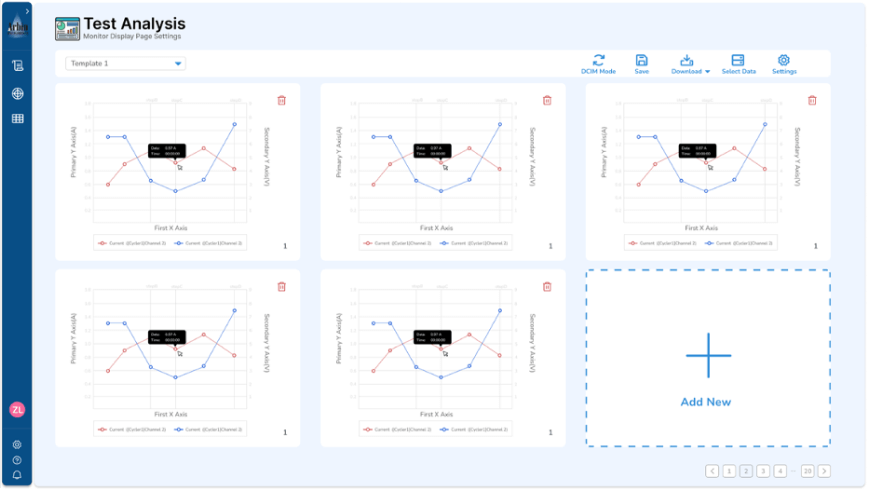
A key feature that sets this graphing tool apart from others is its robust comparison capabilities. The tool excels in analyzing and contrasting data across various dimensions, including different test plans, multiple channels, or even individual cycles within a test.
This capability is crucial for identifying trends, spotting anomalies, and gaining a deeper understanding of battery performance. The clarity and detail provided by the comparison feature ensure that every critical insight is captured, supporting informed decision-making and enhancing overall analysis quality.
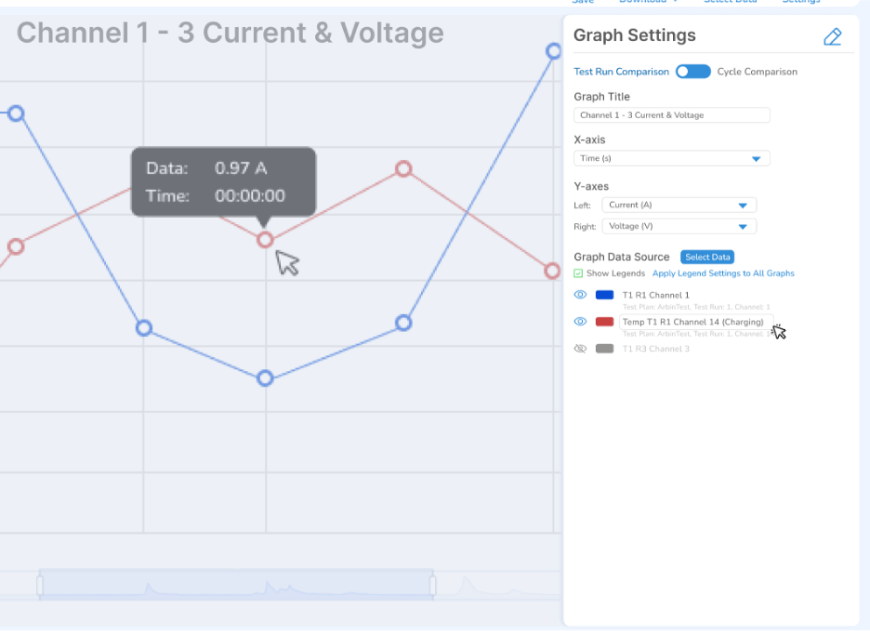
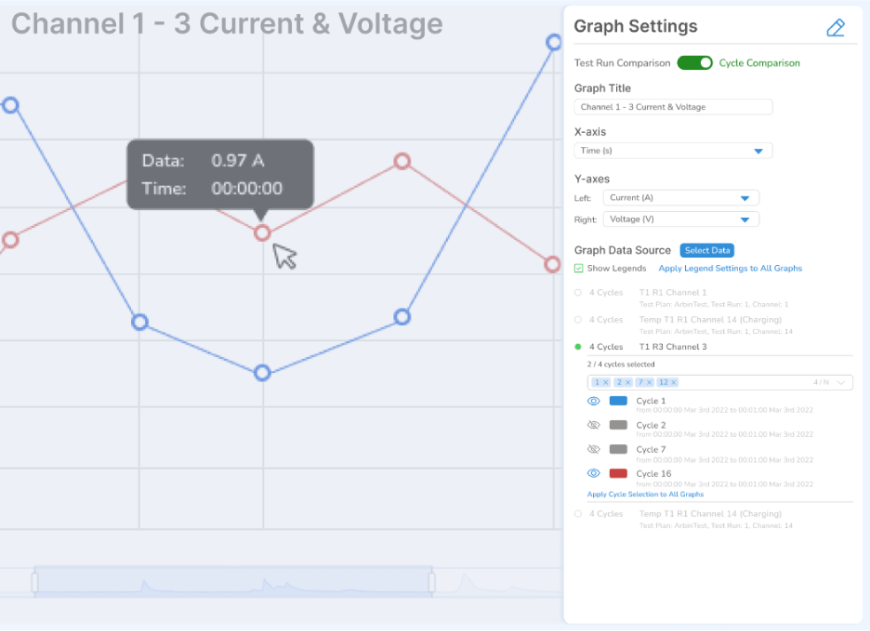
Upon entering the plotting interface, a wealth of customization options becomes available. The tool offers flexibility in how data is presented, from adjusting the number of graphs displayed to selecting specific axes and fine-tuning the style of plots.
The robust export and import functionality supports a variety of formats, ensuring that data can be easily shared or preserved as needed. Whether a quick one-click save is required or a more tailored export using a custom template, the tool adapts to meet the demands of any workflow.
The latest enhancements to the graphing tool include a more powerful template system, which significantly improves the ease of saving and reapplying graph settings. This system allows for the quick recreation of preferred views, reducing the time spent on setup and increasing overall efficiency.
The upgraded graph templates now offer greater flexibility while still providing simplified options for those seeking a streamlined experience. This dual approach ensures that both advanced users and those requiring a more straightforward setup can find the right balance between customization and ease of use.
