Smart Data Logging (Acquistion) User's Guideline

For battery researchers and testers who need to study battery performance, data logging is an important factor, it can provide more accurate current, voltage, time, and temperature data to increase the efficiency of testing analysis.

These technical strategies will need to apply Smart Data Logging (SDL) feature in the battery testing industry, the Arbin Testing System can be used with SDL filtering unchanged data measurement in the experiment, reducing data logging rates, increasing efficiency, and preventing overload of data collections that cause the System Under Test (SUT) to fail the experiment.

Criteria on change logging data point

Parameters
Different Range
Comparision
Target Range
电压范围
∆V=Vpresent - Vprevious
XXmV
电流范围
∆I = Ipresent - Iprevious
>,>=, <, <=, &, ||
YYmA
Time Interval
∆I = Ipresent - Iprevious
>=, >, <, =
ZZms
Table 1

For Example, a tester would like to use SDL to log data if and only if the change in Voltage is equal or greater than 1mV, and current change is greater than 2mA, or time interval is over 10ms to log one data point.

In terms of logical expression, it can be expressed like the following: IF ∆V >= 1mV and ∆I >2mA OR ∆t >=10ms, LOG data point.  Later sections will guide you to implement this logic into Arbin Schedule File.

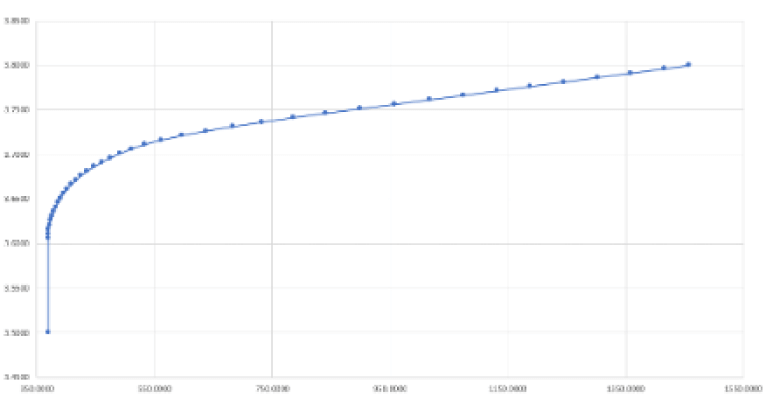
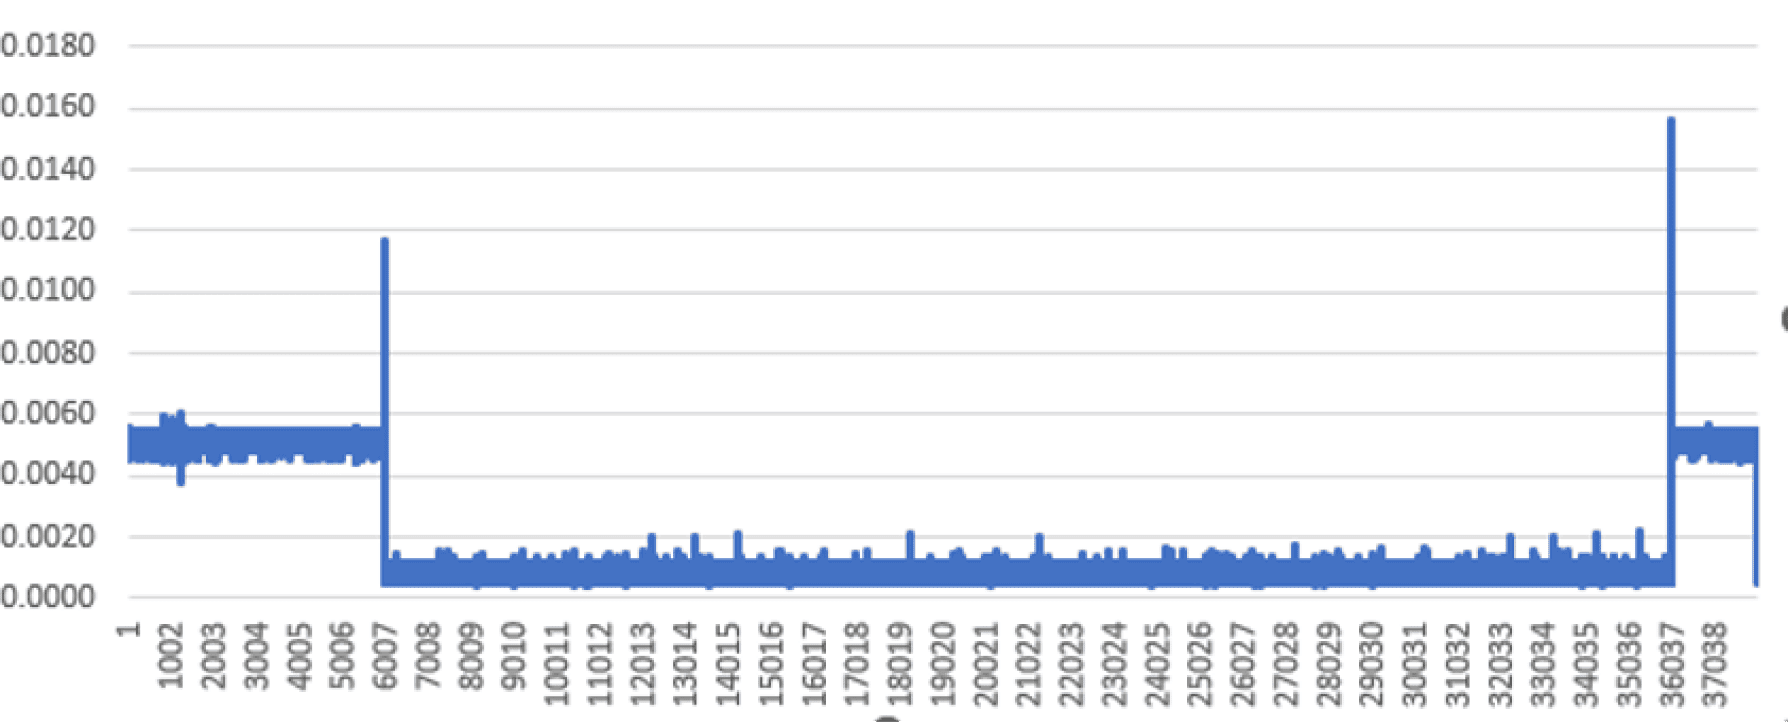
Figure 1.  Regular logging (left) vs SDL (right) 

SDL-Disable
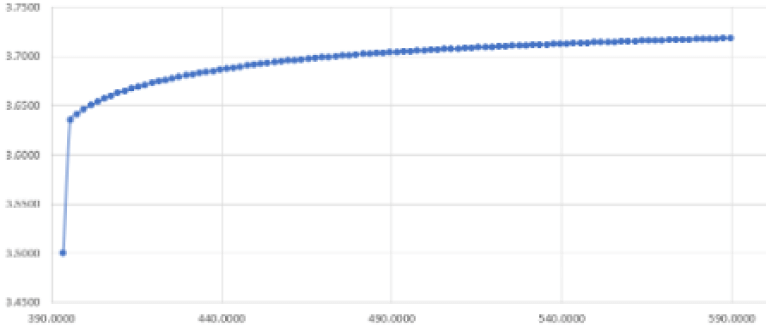
ARBIN-ACL-SDL-Disable

SDL-Enable

ARBIN-ACL-SDL-Enable

People think that logging fast is a method to obtain fluctuations in voltage or current during battery testing, however, high logging rates in battery testing may not provide more information because the state of change is very slow.

Fast logging rates may put more stress on database servers, RAM, memory resources, and network bandwidth that potentially bring the PC under test to losing data or low performance.

Arbin Mits 8.x utilizes an SQL database server with logging a maximum of 20 points/ms (20,000 data points per second).  If we are logging more than 20pts/ms in a test, the data is being buffered in RAM and potentially a PC fails to handle the logged data.

通道数
Logging Rate
PC Insert Rate
No SDL
SDL
Burst Mode
2 CH
60µS
33 pts/ms = 33k /sec
没有
4 CH
60µS
66 pts/ms = 66k /sec
没有
6 CH
60µS
100 pts/ms = 100k/sec
没有
8 CH
1ms
8pts /ms = 8,000/sec
没有
16 CH
1ms
16pts /ms = 16,000/sec
没有
32 CH
1ms
32 pts /ms = 32,000/sec
没有
没有
64 CH
1ms
64 pts /ms = 64,000/sec
没有
没有
96 CH
1ms
96 pts/ms = 96,000/sec
没有
没有
128 CH
1ms
128 pts/ms = 128,000/sec
没有
没有
Table 2: Mits 8.x PC Comparison No-SDL/SDL.

The granularity of ∆V, ∆I, and ∆t value range must be within the precision and accuracy of ADC specification or Arbin Precision System in term PPM.

For example, a system with 100 PPM (100/1M) precision level, then ∆Vand ∆I should be in the range of 0.1mV or 0.1mA, if you set the ∆Vand ∆I in range of 0.01mA or 0.01mV, then data acquisition will not be valuable.

Please be mindful and calculate the change range to log data point precisely to have good data acquisition from your experiments.

Arbin Smart Data Logging Solutions

To achieve the Smart data logging, Arbin has developed 5 flexible solutions that can be applied depending on the need of our customers' demand.  We will describe step-by-step how to configure, setup, and run these methods.

METHOD 1
METHOD 1. Using ∆V or ∆I as logging limit, instead of ∆T. 
Compared with regular data logging that uses time (∆T) as the log limit, smart data logging used more variables as the log limit such as voltage, current, ∆V (change in voltage), and ∆I (change in current).
For example, you can log the data for every 2mV change in voltage. When using the SDL, the ADC still reads the data continuously, but the system will only log the data based on the user-defined limit. 
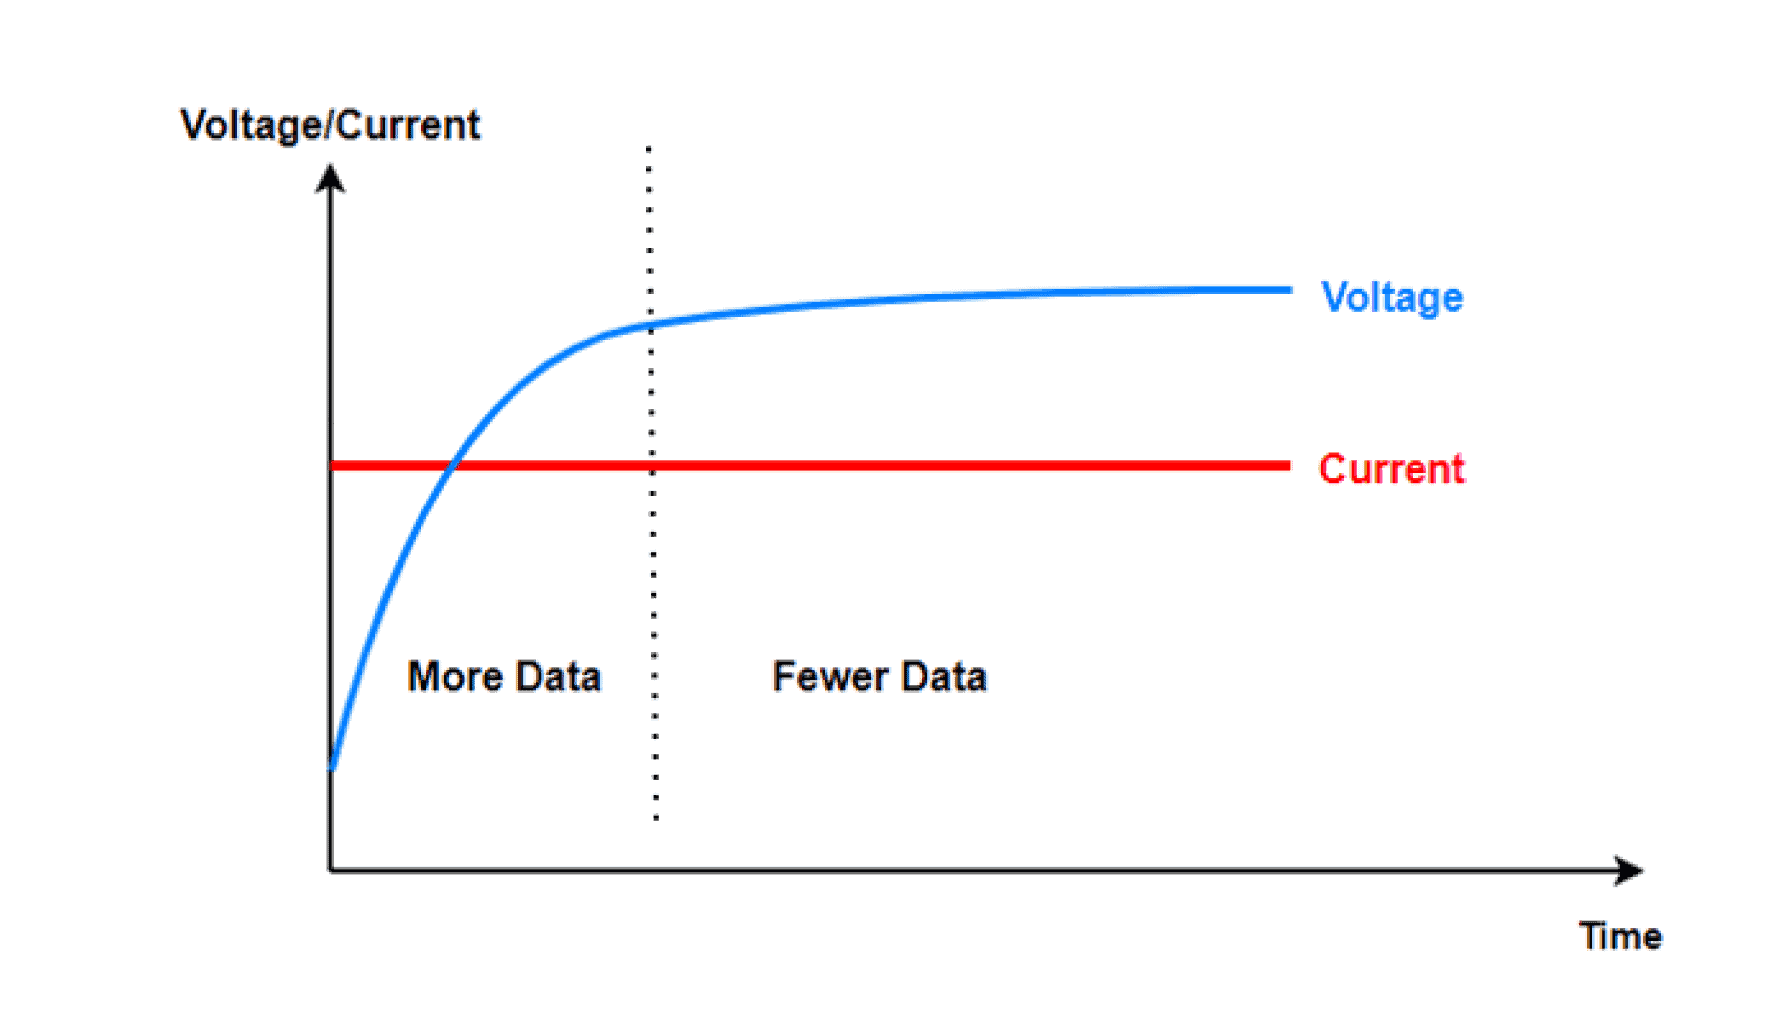
Let us look at a sample example of using SDL in battery testing – charging the battery with a constant current. When applying a constant current to a battery, we care more about the voltage change.
Therefore, it is an innovative idea to use ∆V as the log limit. The voltage of the battery will not be a linear curve -- the change in voltage will be faster in the beginning and slower at the end.
By setting a certain ∆V as the limit, we expect to log more data points in the beginning and fewer data points near the end.
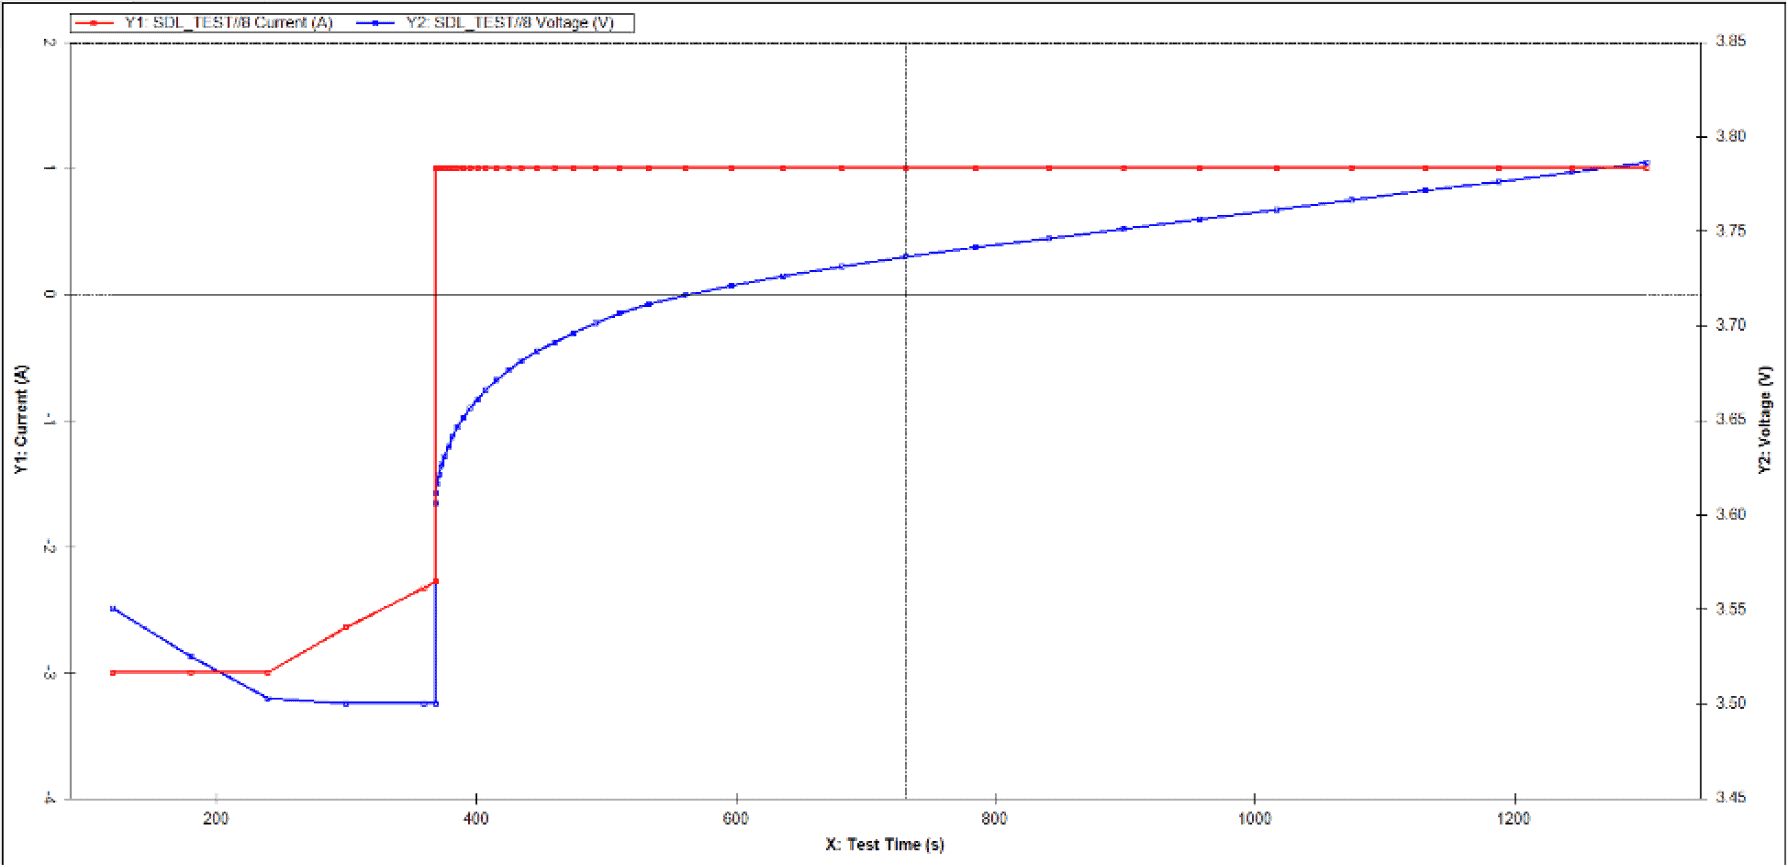
Compared with the regular log limit method using a time limit, SDL comes with fewer data points but can still show battery performance. 
Figure 2. Voltage/Current vs. Time During Battery Charging Test 
We can see another more complicated example of CCCV test (constant current to constant voltage). This test is to charge the battery to a target voltage level using the constant current, and then hold the battery at constant voltage level.
At the CC (Constant Current) stage, the current will be the constant and the major change will be on the voltage. At the CV (Constant Voltage) stage, the voltage will be the constant and the major change will be on the current.
In this condition, neither voltage nor current will be considered as a suitable log limit because they are used as part of the test.
The change in capacity will be a viable choice. Arbin provides multiple variable types that you can choose from for the log limit. Different tests should have different log limit settings.  
Regular Data Logging 
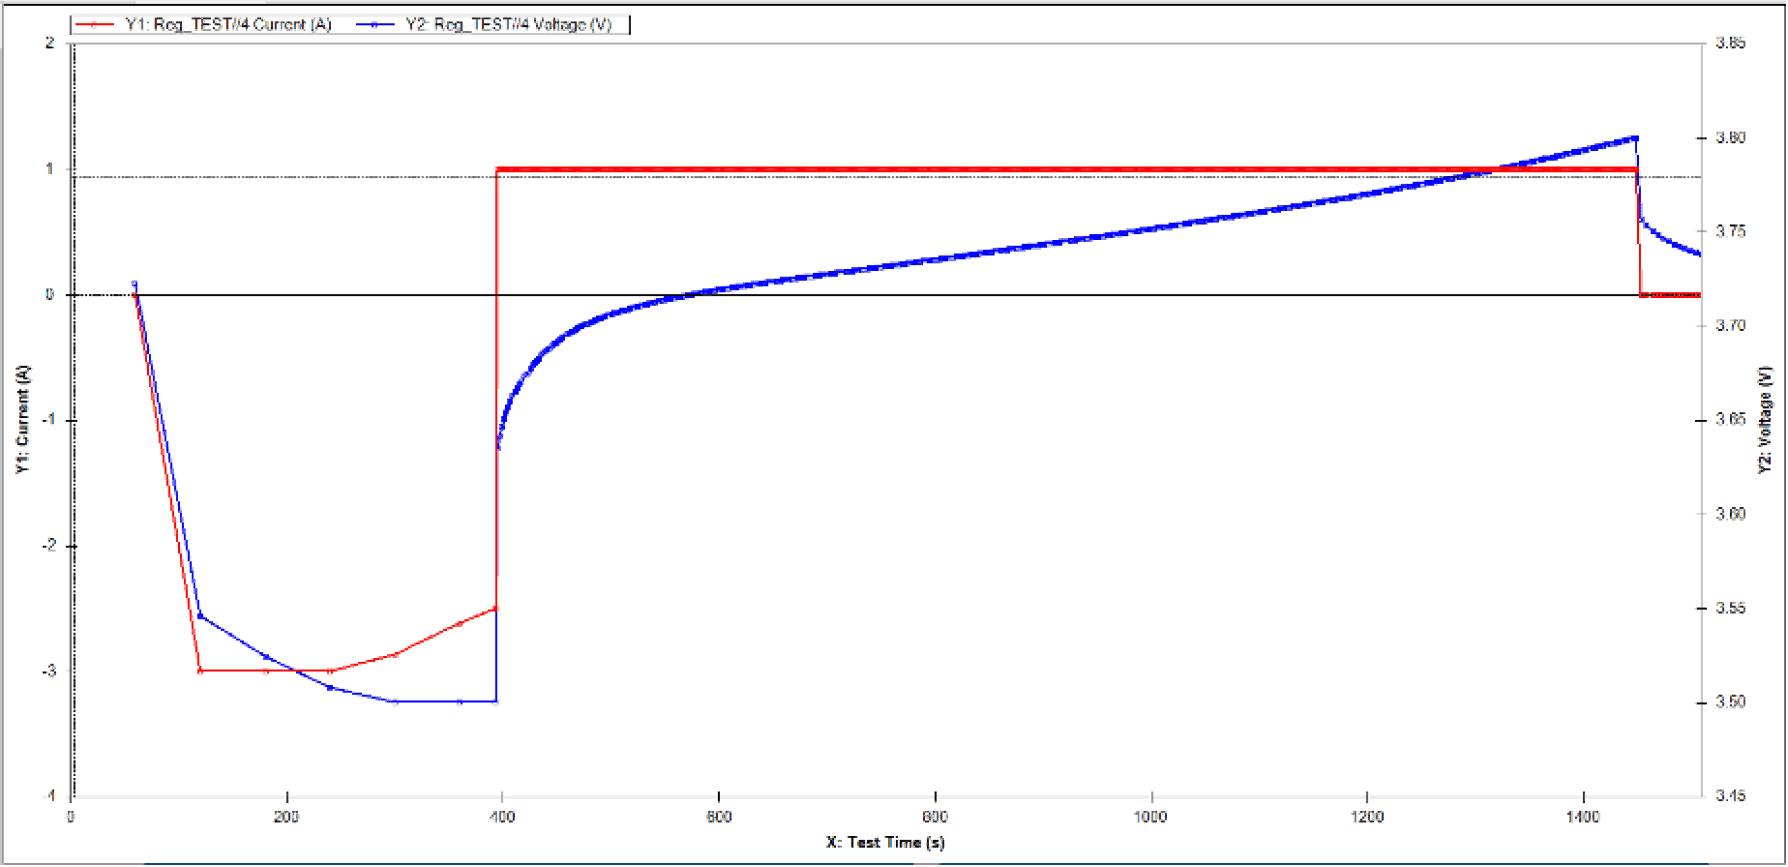
Charging the battery to 3.8V using 1A current and keep logging data every 2 seconds. 
Figure 3. Testing Schedule for Regular Data Logging
Figure 4. Testing Result for Regular Data Logging
Criteria on change logging data point
METHOD1. Applying SDL with Arbin Cyclers using Mits Pro 8
Smart Data Logging
Charging the battery to 3.8V using 1A current and log data when ∆V > 5mV or every 5 minutes.
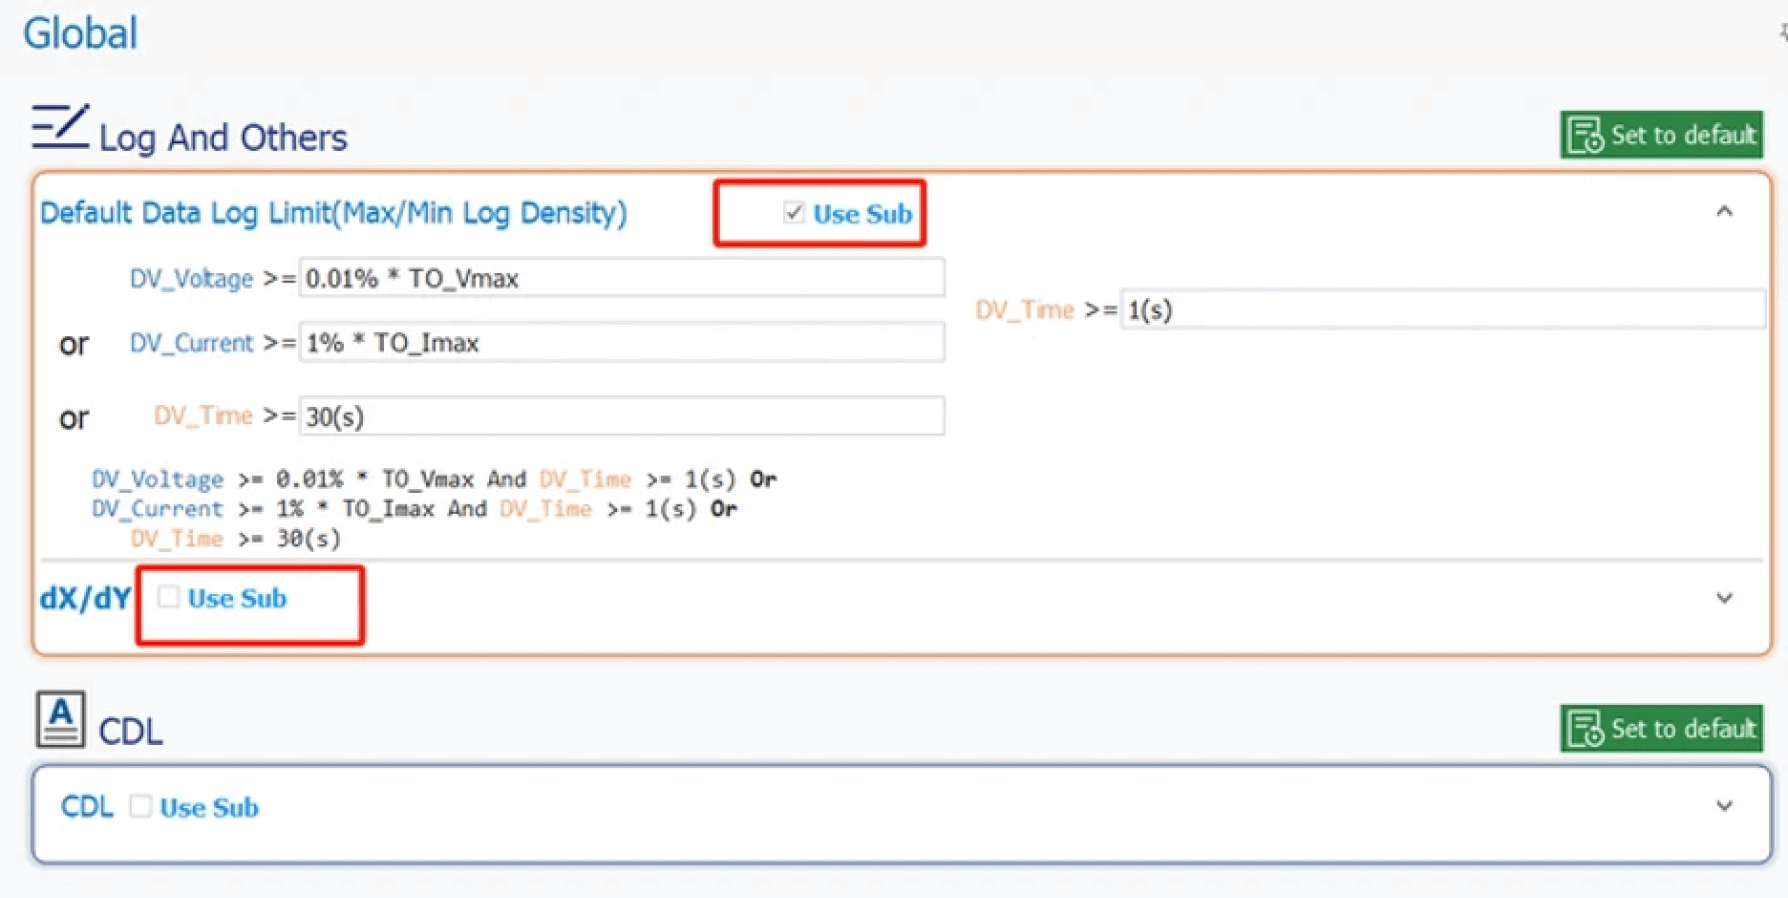
Figure 5. Testing Schedule for Smart Data Logging (Mits Pro8)
METHOD1. Applying SDL with Arbin Cyclers using MITS
Smart Data Logging
Charging the battery to 3.8V using 1A current and log data when ∆V > 5mV or every 5 minutes.
Figure 6. Testing Schedule for Smart Data Logging (MITS)
Figure 7. Testing Result for Smart Data Logging
METHOD 2
METHOD 3
METHOD 4
METHOD 5

总结

Using SDL with Arbin cycler can provide a more accurate and efficient way of data logging when doing the multi-channel testing on cells.

This integration stands as a testament to the commitment to excellence in scientific research and technological advancements, offering a cutting-edge solution for those seeking a robust and efficient approach to data acquisition.

滚动到顶部